Make energy losses measurable in production.
Energy figures become valuable when they show what is driving cost in production. Build that insight step by step, adding detail only where it helps answer a clear production question.
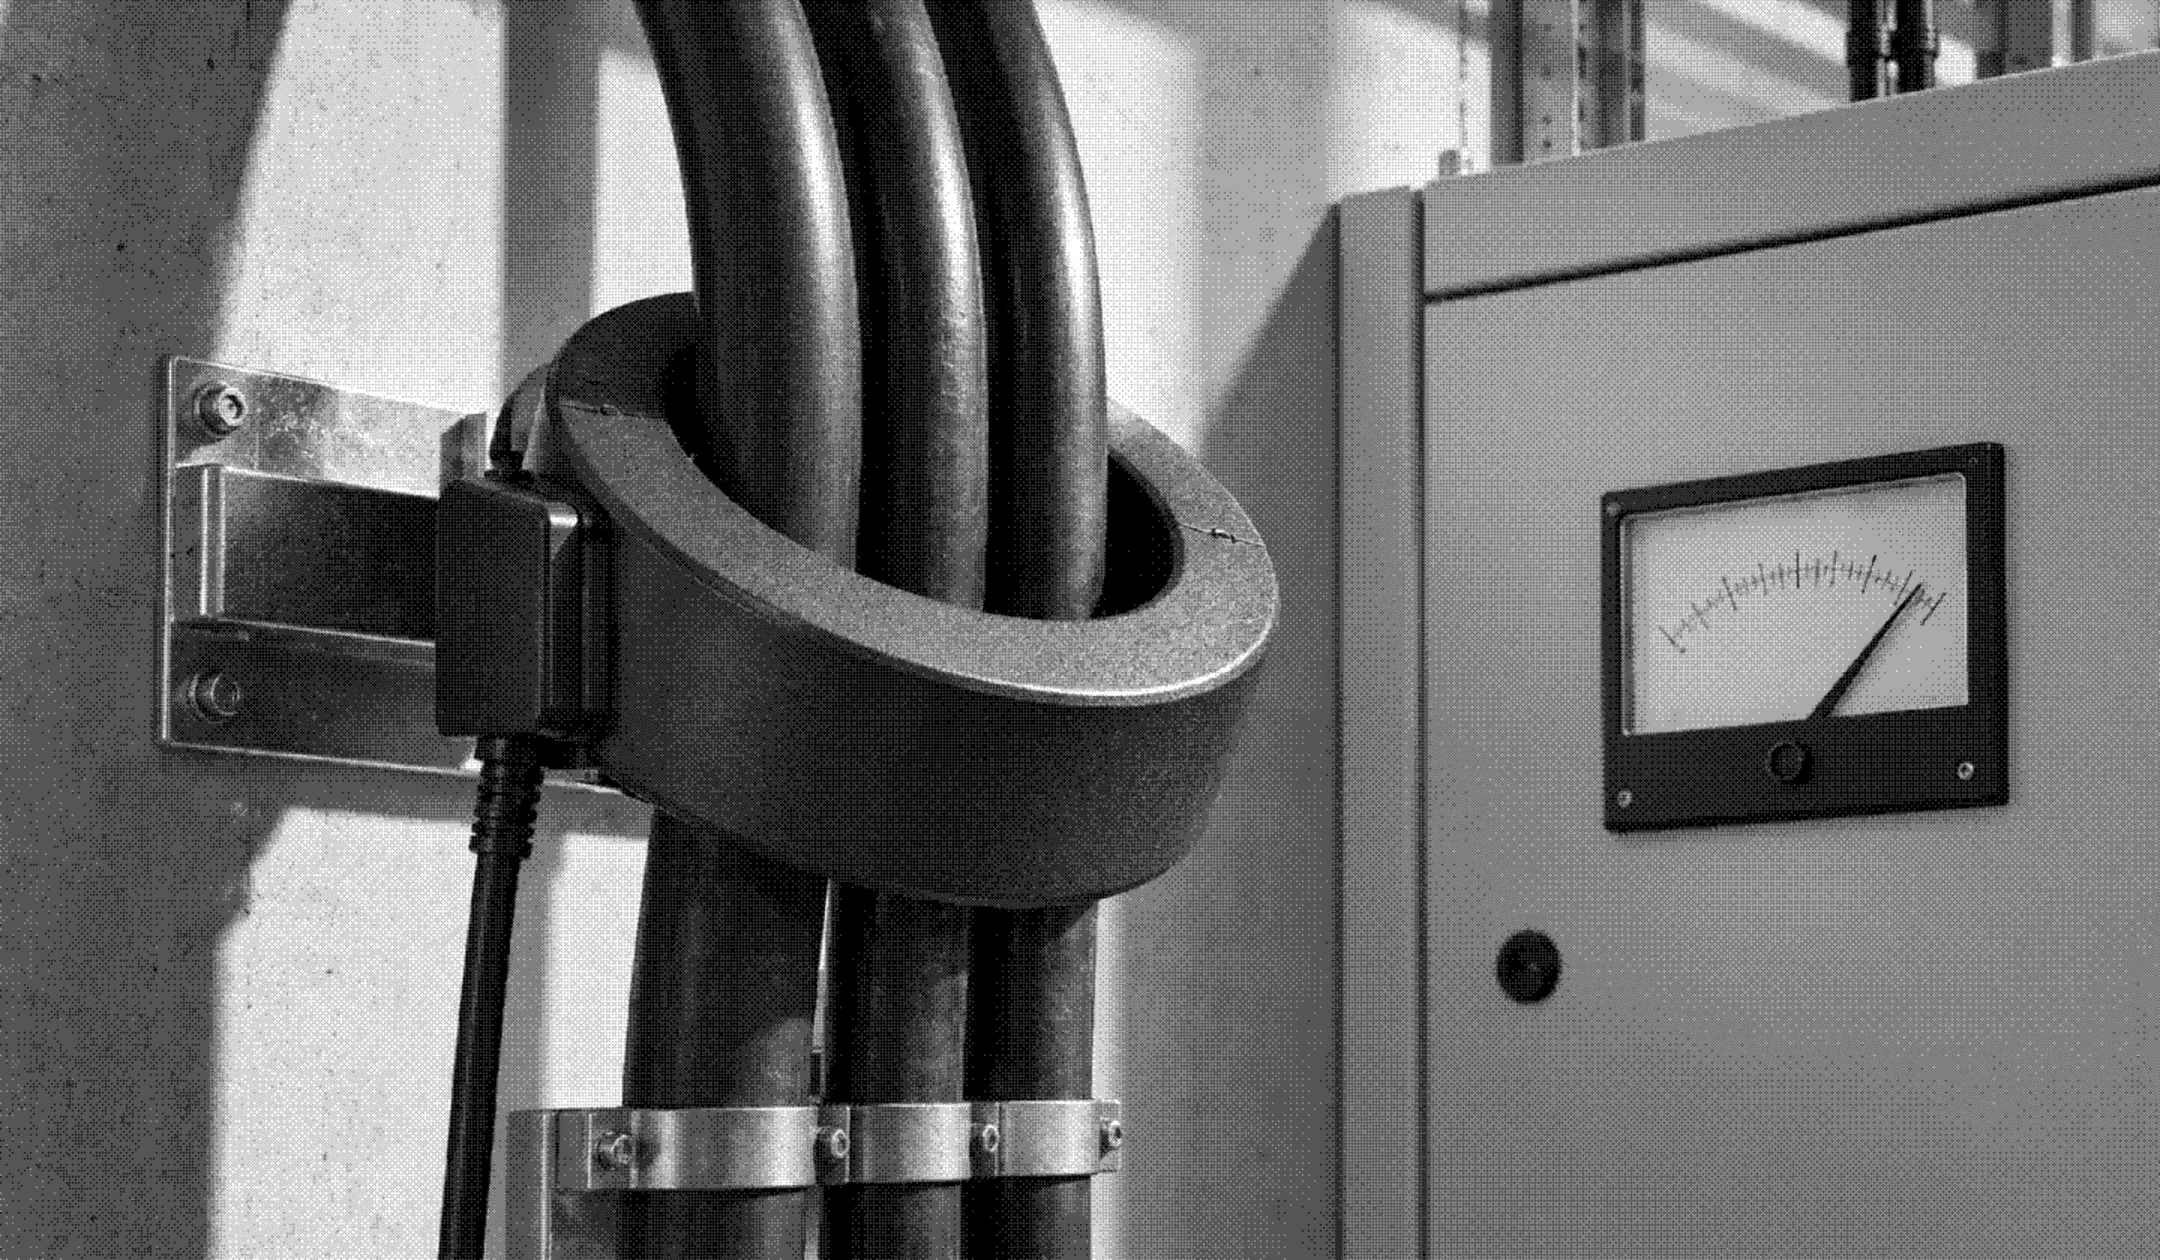
Energy monitoring often starts at the wrong level.
Energy data often already exists, from invoices and main meters to local systems and dashboards. The challenge is knowing at which level to start and which production context is needed to make that data useful.
Teams can remain at monthly totals or move straight into detailed machine-level metering. In both cases, they risk collecting data without knowing where further investigation or investment will create value.
The gap between measuring and improving
- Energy use changes, but teams can’t link it back to what happened in production.
- More meters are installed before it is clear what the extra detail should reveal.
- Consumption is visible on a dashboard, but the next action stays unclear.
Energy monitoring is not the end goal.
Energy monitoring is the first step towards managing energy as part of continuous improvement. By connecting consumption to production context, it makes waste, costly peaks and inefficient operating states measurable.
Start high-level
Use the data already available to map total energy consumption across sites, halls or major processes before looking at individual machines.
--
Add production context
Connect energy use to the relevant line, batch, downtime or operating state to explain why consumption changed.
--
Zoom in with a reason
Add detailed metering or analysis only when the high-level view raises a specific question worth investigating.
--
Grow towards predictive energy management
Use monitoring to improve daily decisions first. Forecasting, energy-aware planning or automated control can follow when there is a clear use case.
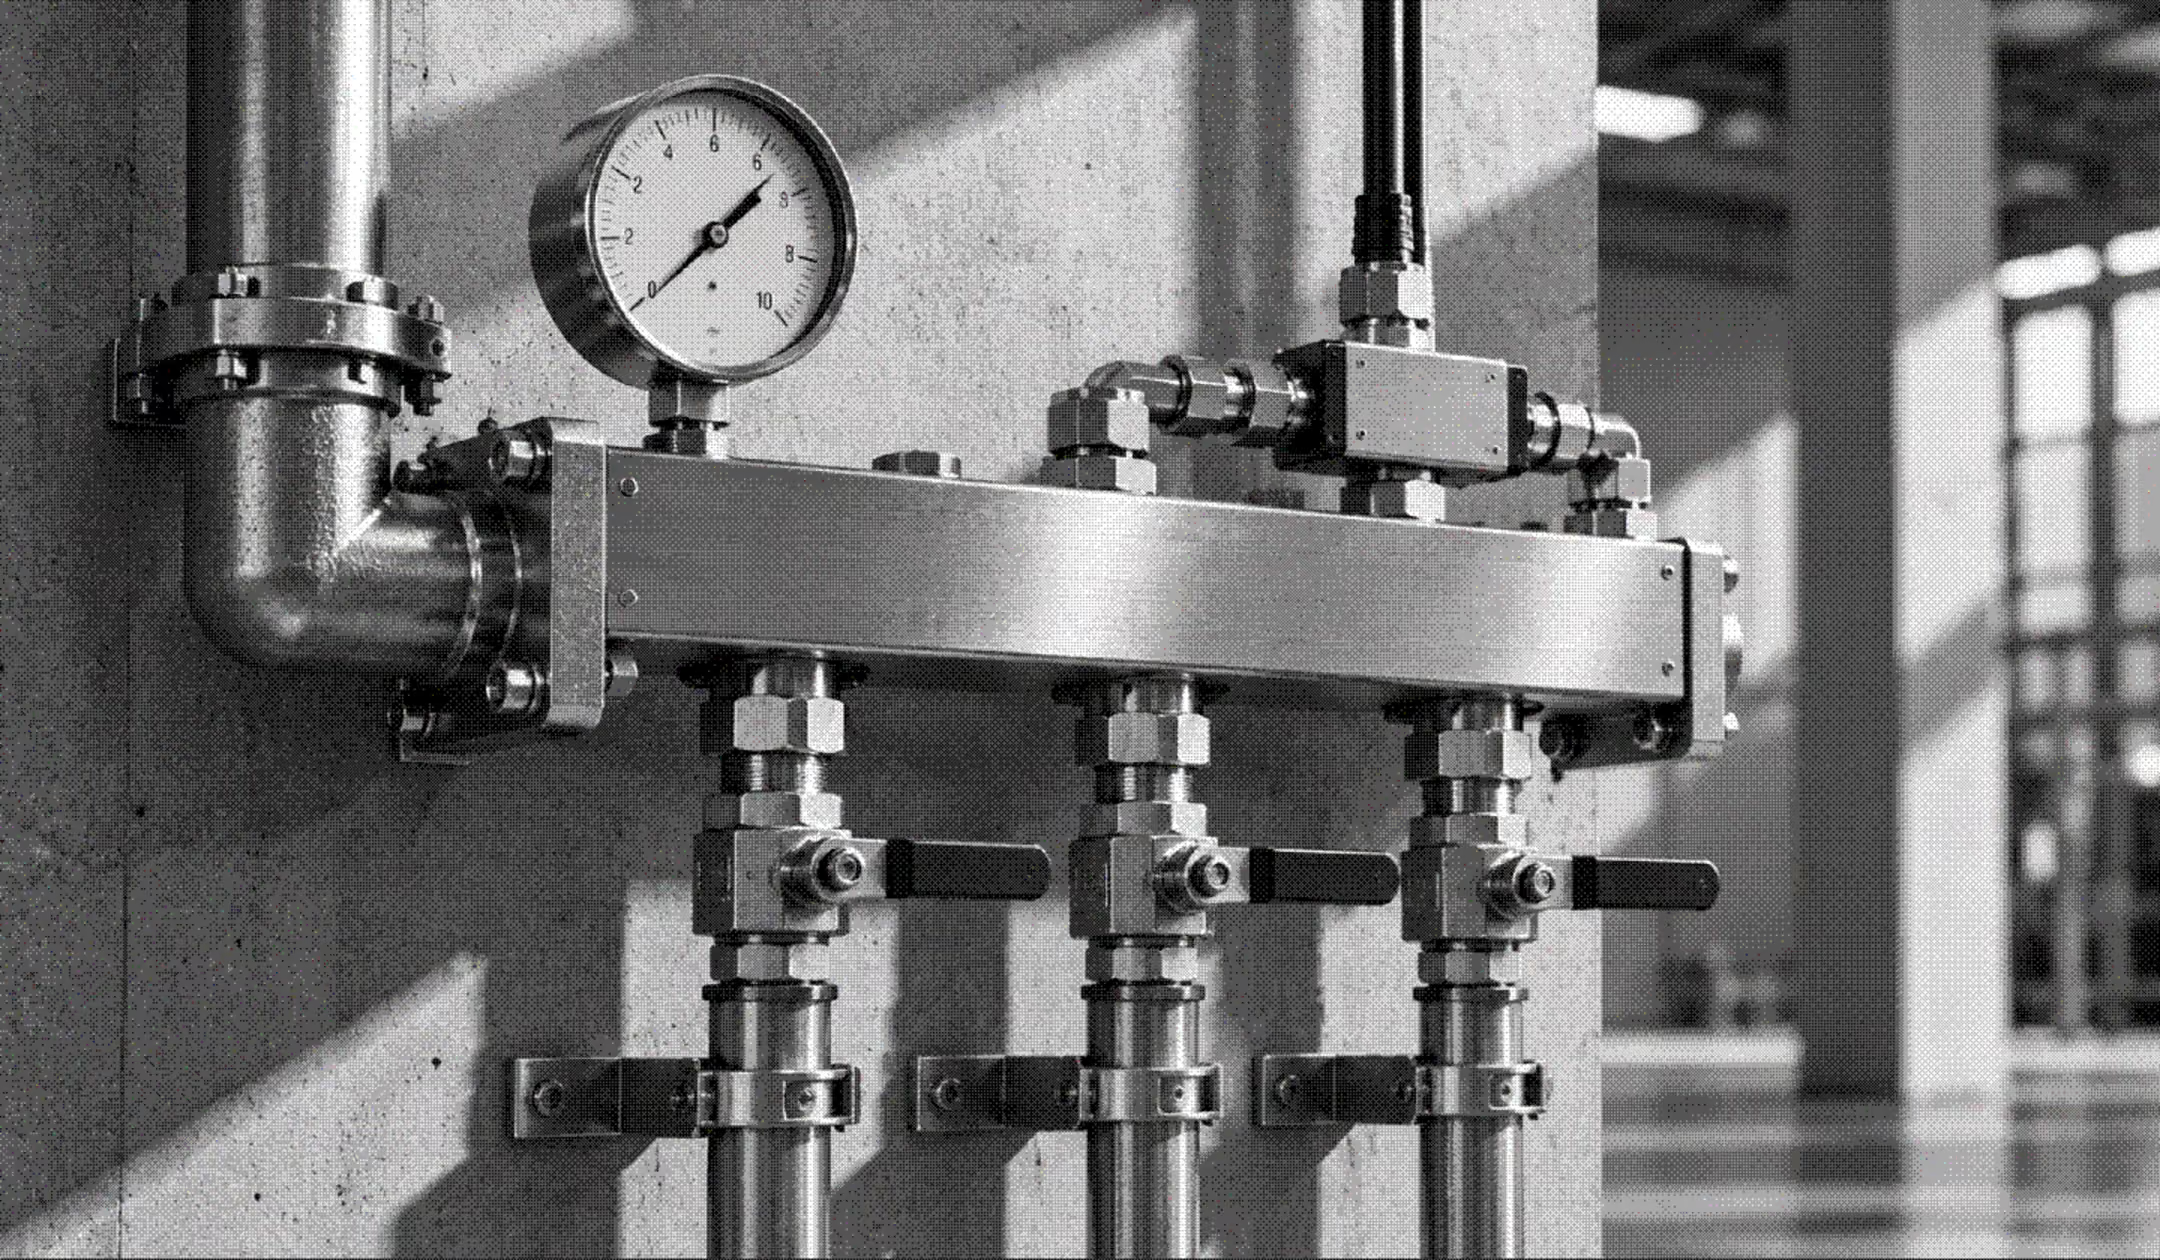


Put energy figures in their production context.
MES and shopfloor applications show which order, batch, product or operating state was active when energy was used. Connecting that information to meter data makes consumption easier to explain and compare.

Find the patterns behind energy use.
Combine energy and production data to identify losses and unusual consumption. Use dashboards to investigate what happened, then forecasting or predictive models to anticipate what may happen next.
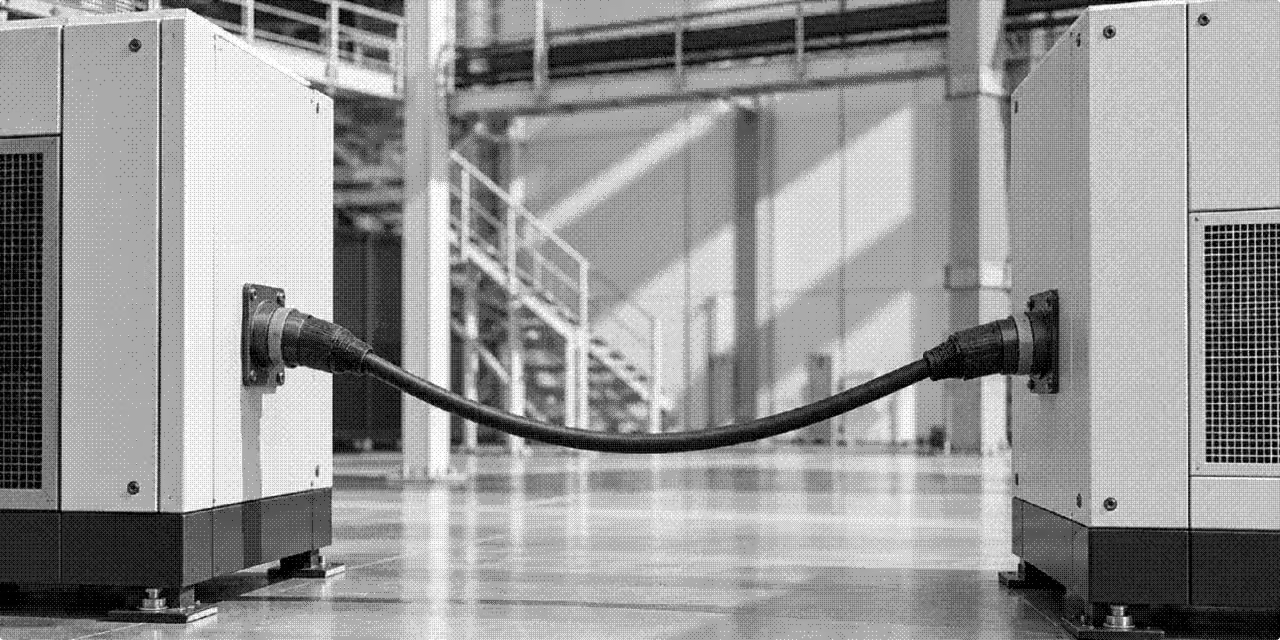

Build one foundation for your energy data.
Connect meters, sensors, PLCs and external sources through a shared industrial data layer, such as a Unified Namespace. New measurements can follow the same structure, avoiding a growing web of point-to-point connections.
Energy efficiency should strengthen production.
The goal is not simply to consume less. It is to reduce avoidable cost while protecting output, quality and the flexibility production needs.
Focus on the utilities that cost most.
Compare consumption across sites, processes and utilities so improvement efforts target the largest cost drivers, whether in electricity, gas, compressed air, water or elsewhere.
--
Balance energy savings with production performance.
Assess consumption alongside output, quality and process requirements, so lower energy use does not create losses elsewhere.
--
Support energy audits with reliable data.
Keep consumption data structured and traceable across sites and processes, making it easier to prepare audits and track progress on improvements.
After every stopEtex found excessive energy consumption after production downtime.
1°CA one-degree change in cooling can lower energy cost without losing process control.
From the shop floor, into practice.


Energy management with Etex
Etex used data analysis to cut energy waste at its plasterboard plants, uncovering excess consumption after every production downtime.

How PSS built a digital manufacturing culture with a custom Mendix MES
How do you build a digital culture that operators actually embrace and keep using? Premium Sound Solutions produces 120 million speakers a year across six global plants for automotive and consumer goods where traceability and quality are non-negotiable.

Sibelco - Workorder Execution App
As Sibelco’s Mendix partner, we co-created their first native low-code app to streamline their maintenance management and integrate it with SAP S/4HANA. The resulting app has improved operating efficiency for technicians, planners and supervisors throughout the organisation.
Terumo's traditional Japanese decision-making process (Ringi) kick-started their low-code journey
Terumo, a global leader in medical technology and innovation, began their low-code adventure by reimagining the Japanese business practice of ringi in the digital era. From there we moved to manufacturing, using Mendix to stream-line their shop floor in Leuven and beyond.
A few things you may want to know.
Learn more about how Mayker scopes, builds and supports applications for production environments.
Energy monitoring shows how, where and when energy is used, giving teams the insight to make informed decisions. Energy management goes further by using forecasts or automation to influence consumption.
Often, yes. Energy monitoring can start with data from existing meters, PLCs and production systems. Mayker connects what is already available and adds measurement where important information is still missing.
Not by itself. An effective energy monitoring dashboard helps teams investigate unusual consumption, understand what caused it and decide what needs to change. Simply displaying energy figures does not reduce energy costs.
Energy monitoring can connect consumption to the active batch, product and production conditions. This helps teams compare similar runs and investigate why some batches consume more energy than others.
At Etex, it showed that gas was the main energy driver in plasterboard drying and exposed excessive consumption after production downtime. At Ardo, it helped assess how adjusting the cooling temperature by one degree could reduce energy use without losing process control. (mogen we ardo benoemen?)